A New Way to Counter Flu Viruses

Flu virus blocked by empty Q-beta phage carrying faux lung sugars

With COVID spread as daily news, we looked for hopeful news highlighting potential ways to counter flu virus. We found many novel approaches to combatting flu virus and chose to illustrate a Berlin, Germany study where researchers at FMP and Humboldt University are collaborating to research avian flu / seasonal flu treatment options.
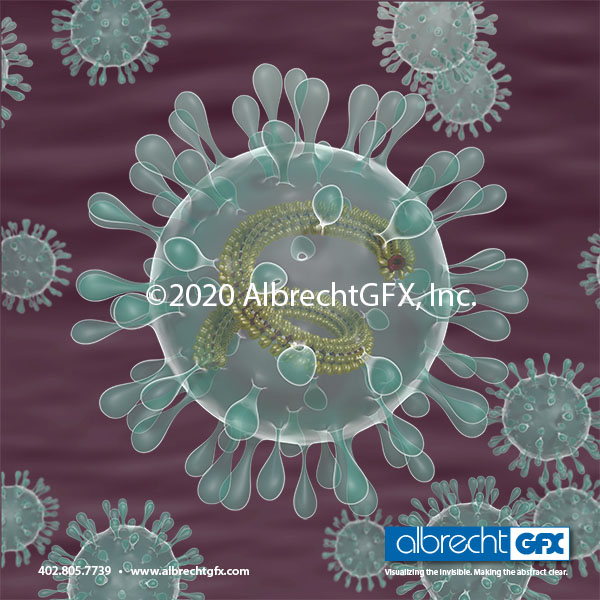
When researchers noted that strong multiple bonds formed between flu virus and lung cell tissue, they focused on this bond as a potential way to block the virus from infecting lung cells.
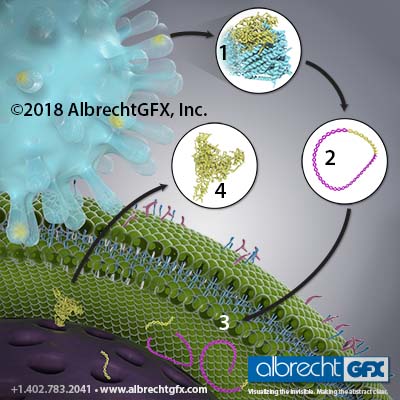
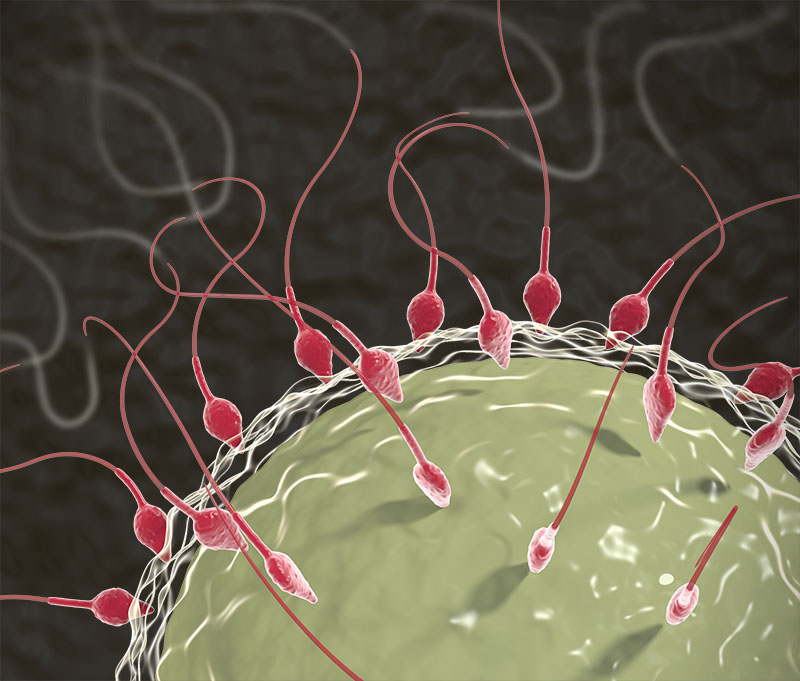
  The next step was to create a faux lung cell from an empty Q-beta bacteriophage and cover the phage surface with the same sugar molecules (sialic acid) found on lung cell surface to which viruses attach. The deception worked. Influenza viruses formed tight bonds to faux lung cell sugars, bonds so strong that influenza viruses could not detach to infect actual lung cells.
The study has since been broadened to include coronavirus. The study’s results were published in a recent article in Nature Nanotechnology:  “Phage Capsid Nanoparticles with Defined Ligand Arrangement Block Influenza Virus Entry.”

Coronavirus

Coronavirus, a Global Health Emergency.

Coronavirus

Named for the crownlike spiky projections surrounding the virus
• 17,000+ human cases worldwide as of 2-3-2020
• Upper respiratory illness in chickens, bats, dogs, cats, ferrets, camels, cattle
• Enteric illness in cattle and pigs
• 7 types of Coronavirus infect people
Primarily causes mild to moderate upper respiratory symptoms
Also includes severe respiratory problems– SARS (Severe Acute Respiratory Syndrome) & MERS (Middle Eastern Respiratory Syndrome)
• How Spread:
Through air-coughing, sneezing
By contact – touching infected surfaces (Doorknobs) & personal contact, e.g.,
shaking hands
The Coronavirus above is a derivative work – that is, we revised an existing 3D Coronavirus model in our personal archives to create the new graphic. Reusing/revising existing 3D models saves time and money.

Molecular View: Gut Microflora Imbalance Damages Cell

We describe what we do as “visualizing the invisible. Making the abstract clear.” 

Most of our work is on the cellular level, but we’ve noticed an increased interest in illustrations on a molecular level. 

Changing magnification level changes the elements in a graphic. 

Cellular level visual:  includes cells on gut wall covered by finger-like projections (villi) and microvilli on cells’ villi surface.

Molecular level visual:  close up of Brush Borders on Microvilli that cover one cell’s surface. Villi not shown.

Our first 3D sample of the gut biome –molecular level, depicting one cell in an out-of-balance gut microbiome due to food poisoning. Unchecked, bacterium Clostridium perfingens damages microvilli the cell’s walls and causes contents to leak.

Using Visuals

iPhone Gallery

Portable Gallery

For years, I was lax at keeping my cell phone charged and available when attending social gatherings. That doesn’t happen any more. Now I have an iPhone gallery of illustrations so anyone can see what we do when they ask about our company. That principal works for everyone.

Visuals (3D illustrations & animations) bridge language barriers and levels of technical experience in a way that words alone cannot. Visuals make messages memorable and easier to understand.

If you haven’t done so, check our online gallery. The gallery is a compilation of sample illustrations that cover a variety of biological topics and show technical expertise. Email or give us a call if you’d like to discuss your project.

Gut Microbiome Imbalance

Gut Microbiome Imbalance

Gut Microbiome Imbalance

Gut Microbiome Imbalance
This illustration is one of three illustrations depicting differences between balance / imbalance in gut “bugs.” It shows a bacterial infection in colon tissue caused by a microbiome imbalance. The imbalance reduces the clear slimy layer (butyrate) covering villi. Without a solid butyrate layer, bacteria invade the exposed tissue between villi. The body’s immune system responds and sends red blood cells, T-cells, and macrophages to the area to fight the pathogens.

The legend inset shows C. difficile and E. coli bacteria along with T-cell and macrophage that respond to infection.

At some point, the illustration may be a starting point for an animation.

Visualizing Biological Science

Sperm & Egg

Sperm and Egg

Owning a business is not easy, but it has a few incredible benefits. One of those perks is the opportunity to focus our 3D illustration / animation company capabilities on subject matter of personal interest and curiosity. For us, that subject is biological science.
Our online gallery includes visuals related to both plants and animals. The gallery has a few graphics related to plants, but the majority are micro, macro, cellular depictions of animal species, e.g. cattle, horses, pigs, cats, dogs, humans.
We use 3D illustration and animation tools to make biological content available and understandable to a worldwide audience– crossing language barriers and levels of technical knowledge.

Milk Let-down Infographic

Milk Let-down Infographic

Pictured here is a molecular sequence that occurs every day in dairy milking parlors­–milk let-down.

The chain of events involved in milk let-down is difficult to show because the sequence involves both the nervous system and circulatory system throughout the body. We’ve used numbers, callouts of specific body regions, and colored arrows to trace the pathway through the body.
As good as this illustration is, we think animation makes this idea easier to understand. As I write this, Don is working on the animation. We’ll post a link to the animation when it is available.

(1)Teat suckling (by calf or milking machine) sends nerve impulses to the brain’s hypothalamus(2) and on to the pituitary(3). The pituitary gland secrets oxytocin into the blood stream, which carries it to udder alveoli(4). Udder alveoli contract to let down milk.

Yellow arrows = nervous system pathway
Green arrows = circulatory system pathway
Note: oxytocin molecule in background


Trade Show Graphics


Roots & Nematodes

The illustration above shows nematodes in the soil ready to feast on soybean roots. It’s a bold image and a favorite of mine that we often use in our trade show exhibit.

With a trade show coming up, we’re reviewing all of our display graphics. Our illustrations cover macro, micro, and cellular level depictions of topics such as:  respiratory issues, nutrition, immunity, and genetics. We look for eye-catching, vibrant visuals that have broad content appeal and connect with our audience:  researchers, sales/marketing and training professionals, and advertising agencies.

We are successful when trade show attendees see visually appealing graphics that pique an interest in the subject matter and what we do: convert technical content into visuals that appeal to both technical and non-technical audiences.